Product, Order & General Inquiries +1 (800) 663-7845 (8am-4:30pm PST)
Call ACR Now
Call ACR: 1-800-663-7845
North America: 1-800-663-7845
International: +1-604-591-1128
Mon–Fri 8:30 AM – 4:30 PM PT
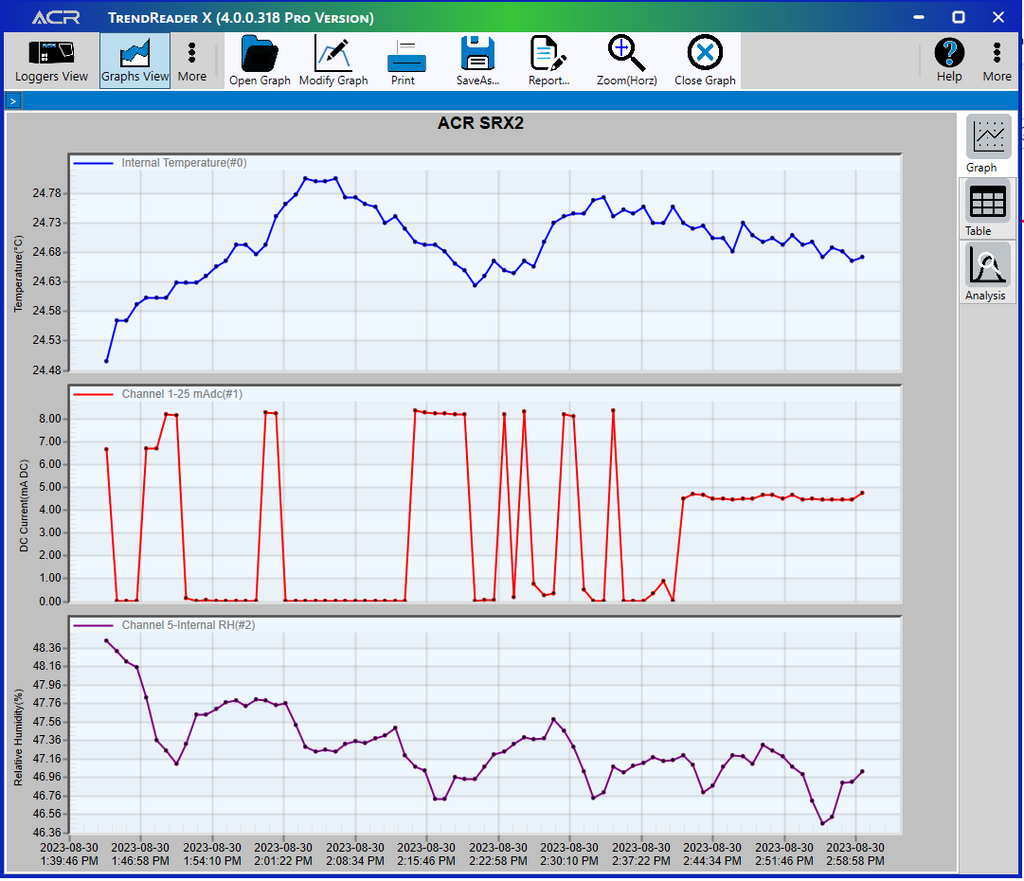
Powerful graphing & analysis software designed exclusively for ACR's SRX and JR product families. Available in both Basic & Pro versions.
TRX Basic - available at no charge when you purchase any SRX model
TRX Pro - requires a license key to activate Pro Features
| Features & Benefits | TRX Pro | TRX Basic |
|---|---|---|
| Ability to send emails in response to alarm from logger | ✓ | |
| Ability to generate a Summary Report with data from Analytics section and generate a graph | ✓ | |
| Ability to Concatenate graphs | ✓ | |
| Can create Compound line equations for additional data manipulation. | ✓ | |
| Can create custom Linear, Thermistor, Polynomial and User defined equations. | ✓ | |
| Compatible with SmartReader Plus data loggers | ✓ | |
| Ability to add custom units not found resident in the software | ✓ | |
| Ability to merge graphs (open multiple graphs simultaneously) | ✓ | ✓ |
| Ability to configure both Warning & Critical alarms | ✓ | ✓ |
| Can create custom Linear equations. | ✓ | ✓ |
| Real Time Graphing approx. every 5 seconds (not adjustable). Pro has more data points (1000 vs 50) | ✓ | ✓ |
| Downloaded data can be displayed as a Graph or as a Table for easy export | ✓ | ✓ |
| Downloaded graph analysis (min, max. etc.) | ✓ | ✓ |
| Graph with all channels on a single graph, or Stacked by unit type, for a cleaner looking graph | ✓ | ✓ |
| Ability to add comments, label data points & zoom graph | ✓ | ✓ |
| Ability to turn graph channels on/off, specify Y - min/max/auto | ✓ | ✓ |
| Easy to calibrate, the offset is in engineering values instead of bytes, making it more intuitive | ✓ | ✓ |
| Delay start can be set to 2 months away (SRX) | ✓ | ✓ |
| Quick-start Wizards provide step-by-step instructions and explanations for basic set-up for new users | ✓ | ✓ |
| Quick downloads and easy logger set-up - driver based. Ability to connect to SRX & JR2000. Setup most logger features - download, graph, export, print | ✓ | ✓ |
| One-touch table views - copy & paste to other programs | ✓ | ✓ |
| Presentation quality graphs - fixed comments & data labels | ✓ | ✓ |
| Export capabilities (TXT, BMP, PDF, JPG, and CSV formats) | ✓ | ✓ |
| Open multiple logger connections simultaneously. | ✓ | ✓ |
Q&A
{"id":7652673716395,"title":"TrendReader TRX Pro","handle":"trx-software-pro","description":"\u003cp\u003e \u003c\/p\u003e\n\u003cp data-mce-fragment=\"1\"\u003ePowerful graphing \u0026amp; analysis software designed exclusively for ACR's SRX and JR product families. Available in both Basic \u0026amp; Pro versions.\u003c\/p\u003e\n\u003cp data-mce-fragment=\"1\"\u003e\u003ca href=\"https:\/\/acrsoftware.s3.us-west-1.amazonaws.com\/Setup+for+ACR+TrendReader+X.EXE\"\u003e\u003cstrong\u003eTRX Basic\u003c\/strong\u003e\u003c\/a\u003e - available at no charge when you purchase any SRX model\u003c\/p\u003e\n\u003cp data-mce-fragment=\"1\"\u003e\u003cstrong\u003eTRX Pro\u003c\/strong\u003e - requires a license key to activate Pro Features\u003c\/p\u003e\n\u003ctable style=\"width: 871px; height: 675.909px;\"\u003e\n\u003ctbody\u003e\n\u003ctr style=\"height: 39.2045px;\"\u003e\n\u003cth style=\"width: 732.359px; height: 39.2045px; text-align: left;\"\u003eFeatures \u0026amp; Benefits\u003c\/th\u003e\n\u003cth style=\"width: 52px; height: 39.2045px;\"\u003eTRX Pro\u003c\/th\u003e\n\u003cth style=\"width: 64.6406px; height: 39.2045px;\"\u003eTRX Basic\u003c\/th\u003e\n\u003c\/tr\u003e\n\u003ctr style=\"height: 19.6023px;\"\u003e\n\u003ctd style=\"width: 732.359px; height: 19.6023px;\"\u003eAbility to send emails in response to alarm from logger\u003c\/td\u003e\n\u003ctd style=\"width: 52px; height: 19.6023px;\"\u003e✓\u003c\/td\u003e\n\u003ctd style=\"width: 64.6406px; height: 19.6023px;\"\u003e\u003cbr\u003e\u003c\/td\u003e\n\u003c\/tr\u003e\n\u003ctr style=\"height: 38.9915px;\"\u003e\n\u003ctd style=\"width: 732.359px; height: 38.9915px;\"\u003eAbility to generate a Summary Report with data from Analytics section and generate a graph\u003c\/td\u003e\n\u003ctd style=\"width: 52px; height: 38.9915px;\"\u003e✓\u003c\/td\u003e\n\u003ctd style=\"width: 64.6406px; height: 38.9915px;\"\u003e\u003cbr\u003e\u003c\/td\u003e\n\u003c\/tr\u003e\n\u003ctr style=\"height: 38.9915px;\"\u003e\n\u003ctd style=\"width: 732.359px; height: 38.9915px;\"\u003eAbility to Concatenate graphs\u003c\/td\u003e\n\u003ctd style=\"width: 52px; height: 38.9915px;\"\u003e✓\u003c\/td\u003e\n\u003ctd style=\"width: 64.6406px; height: 38.9915px;\"\u003e\u003cbr\u003e\u003c\/td\u003e\n\u003c\/tr\u003e\n\u003ctr style=\"height: 19.6023px;\"\u003e\n\u003ctd style=\"width: 732.359px; height: 19.6023px;\"\u003eCan create Compound line equations for additional data manipulation.\u003c\/td\u003e\n\u003ctd style=\"width: 52px; height: 19.6023px;\"\u003e✓\u003c\/td\u003e\n\u003ctd style=\"width: 64.6406px; height: 19.6023px;\"\u003e\u003cbr\u003e\u003c\/td\u003e\n\u003c\/tr\u003e\n\u003ctr style=\"height: 38.9915px;\"\u003e\n\u003ctd style=\"width: 732.359px; height: 38.9915px;\"\u003eCan create custom Linear, Thermistor, Polynomial and User defined equations.\u003c\/td\u003e\n\u003ctd style=\"width: 52px; height: 38.9915px;\"\u003e✓\u003c\/td\u003e\n\u003ctd style=\"width: 64.6406px; height: 38.9915px;\"\u003e\u003c\/td\u003e\n\u003c\/tr\u003e\n\u003ctr style=\"height: 38.9915px;\"\u003e\n\u003ctd style=\"width: 732.359px; height: 38.9915px;\"\u003eCompatible with SmartReader Plus data loggers\u003c\/td\u003e\n\u003ctd style=\"width: 52px; height: 38.9915px;\"\u003e✓\u003c\/td\u003e\n\u003ctd style=\"width: 64.6406px; height: 38.9915px;\"\u003e\u003c\/td\u003e\n\u003c\/tr\u003e\n\u003ctr style=\"height: 38.9915px;\"\u003e\n\u003ctd style=\"width: 732.359px; height: 38.9915px;\"\u003e\u003cspan\u003eAbility to add custom units not found resident in the software\u003c\/span\u003e\u003c\/td\u003e\n\u003ctd style=\"width: 52px; height: 38.9915px;\"\u003e\u003cspan\u003e✓\u003c\/span\u003e\u003c\/td\u003e\n\u003ctd style=\"width: 64.6406px; height: 38.9915px;\"\u003e\u003cspan\u003e\u003c\/span\u003e\u003c\/td\u003e\n\u003c\/tr\u003e\n\u003ctr style=\"height: 19.6023px;\"\u003e\n\u003ctd style=\"width: 732.359px; height: 19.6023px;\"\u003e\u003cspan\u003eAbility to merge graphs (open multiple graphs simultaneously)\u003c\/span\u003e\u003c\/td\u003e\n\u003ctd style=\"width: 52px; height: 19.6023px;\"\u003e\u003cspan\u003e✓\u003c\/span\u003e\u003c\/td\u003e\n\u003ctd style=\"width: 64.6406px; height: 19.6023px;\"\u003e\u003cspan\u003e✓\u003c\/span\u003e\u003c\/td\u003e\n\u003c\/tr\u003e\n\u003ctr style=\"height: 38.9915px;\"\u003e\n\u003ctd style=\"width: 732.359px; height: 38.9915px;\"\u003e\u003cspan\u003eAbility to configure both Warning \u0026amp; Critical alarms\u003c\/span\u003e\u003c\/td\u003e\n\u003ctd style=\"width: 52px; height: 38.9915px;\"\u003e\u003cspan\u003e✓\u003c\/span\u003e\u003c\/td\u003e\n\u003ctd style=\"width: 64.6406px; height: 38.9915px;\"\u003e\u003cspan\u003e✓\u003c\/span\u003e\u003c\/td\u003e\n\u003c\/tr\u003e\n\u003ctr style=\"height: 19.6023px;\"\u003e\n\u003ctd style=\"width: 732.359px; height: 19.6023px;\"\u003e\u003cspan\u003eCan create custom Linear equations.\u003c\/span\u003e\u003c\/td\u003e\n\u003ctd style=\"width: 52px; height: 19.6023px;\"\u003e\u003cspan\u003e✓\u003c\/span\u003e\u003c\/td\u003e\n\u003ctd style=\"width: 64.6406px; height: 19.6023px;\"\u003e\u003cspan\u003e✓\u003c\/span\u003e\u003c\/td\u003e\n\u003c\/tr\u003e\n\u003ctr style=\"height: 19.6023px;\"\u003e\n\u003ctd style=\"width: 732.359px; height: 19.6023px;\"\u003e\u003cspan\u003eReal Time Graphing approx. every 5 seconds (not adjustable). Pro has more data points (1000 vs 50)\u003c\/span\u003e\u003c\/td\u003e\n\u003ctd style=\"width: 52px; height: 19.6023px;\"\u003e\u003cspan\u003e✓\u003c\/span\u003e\u003c\/td\u003e\n\u003ctd style=\"width: 64.6406px; height: 19.6023px;\"\u003e\u003cspan\u003e✓\u003c\/span\u003e\u003c\/td\u003e\n\u003c\/tr\u003e\n\u003ctr style=\"height: 38.9915px;\"\u003e\n\u003ctd style=\"width: 732.359px; height: 38.9915px;\"\u003e\u003cspan\u003eDownloaded data can be displayed as a Graph or as a Table for easy export\u003c\/span\u003e\u003c\/td\u003e\n\u003ctd style=\"width: 52px; height: 38.9915px;\"\u003e\u003cspan\u003e✓\u003c\/span\u003e\u003c\/td\u003e\n\u003ctd style=\"width: 64.6406px; height: 38.9915px;\"\u003e\u003cspan\u003e✓\u003c\/span\u003e\u003c\/td\u003e\n\u003c\/tr\u003e\n\u003ctr style=\"height: 19.6023px;\"\u003e\n\u003ctd style=\"width: 732.359px; height: 19.6023px;\"\u003e\u003cspan\u003eDownloaded graph analysis (min, max. etc.)\u003c\/span\u003e\u003c\/td\u003e\n\u003ctd style=\"width: 52px; height: 19.6023px;\"\u003e\u003cspan\u003e✓\u003c\/span\u003e\u003c\/td\u003e\n\u003ctd style=\"width: 64.6406px; height: 19.6023px;\"\u003e\u003cspan\u003e✓\u003c\/span\u003e\u003c\/td\u003e\n\u003c\/tr\u003e\n\u003ctr style=\"height: 19.6023px;\"\u003e\n\u003ctd style=\"width: 732.359px; height: 19.6023px;\"\u003e\u003cspan\u003eGraph with all channels on a single graph, or Stacked by unit type, for a cleaner looking graph\u003c\/span\u003e\u003c\/td\u003e\n\u003ctd style=\"width: 52px; height: 19.6023px;\"\u003e\u003cspan\u003e✓\u003c\/span\u003e\u003c\/td\u003e\n\u003ctd style=\"width: 64.6406px; height: 19.6023px;\"\u003e\u003cspan\u003e✓\u003c\/span\u003e\u003c\/td\u003e\n\u003c\/tr\u003e\n\u003ctr style=\"height: 66.946px;\"\u003e\n\u003ctd style=\"width: 732.359px; height: 66.946px;\"\u003e\u003cspan\u003eAbility to add comments, label data points \u0026amp; zoom graph\u003c\/span\u003e\u003c\/td\u003e\n\u003ctd style=\"width: 52px; height: 66.946px;\"\u003e\u003cspan\u003e✓\u003c\/span\u003e\u003c\/td\u003e\n\u003ctd style=\"width: 64.6406px; height: 66.946px;\"\u003e\u003cspan\u003e✓\u003c\/span\u003e\u003c\/td\u003e\n\u003c\/tr\u003e\n\u003ctr style=\"height: 35px;\"\u003e\n\u003ctd style=\"width: 732.359px; height: 35px;\"\u003e\u003cspan\u003eAbility to turn graph channels on\/off, specify Y - min\/max\/auto\u003c\/span\u003e\u003c\/td\u003e\n\u003ctd style=\"width: 52px; height: 35px;\"\u003e\u003cspan\u003e✓\u003c\/span\u003e\u003c\/td\u003e\n\u003ctd style=\"width: 64.6406px; height: 35px;\"\u003e\u003cspan\u003e✓\u003c\/span\u003e\u003c\/td\u003e\n\u003c\/tr\u003e\n\u003ctr style=\"height: 19.6023px;\"\u003e\n\u003ctd style=\"width: 732.359px; height: 19.6023px;\"\u003e\u003cspan\u003eEasy to calibrate, the offset is in engineering values instead of bytes, making it more intuitive\u003c\/span\u003e\u003c\/td\u003e\n\u003ctd style=\"width: 52px; height: 19.6023px;\"\u003e\u003cspan\u003e✓\u003c\/span\u003e\u003c\/td\u003e\n\u003ctd style=\"width: 64.6406px; height: 19.6023px;\"\u003e\u003cspan\u003e✓\u003c\/span\u003e\u003c\/td\u003e\n\u003c\/tr\u003e\n\u003ctr style=\"height: 35px;\"\u003e\n\u003ctd style=\"width: 732.359px; height: 35px;\"\u003e\u003cspan\u003eDelay start can be set to 2 months away (SRX)\u003c\/span\u003e\u003c\/td\u003e\n\u003ctd style=\"width: 52px; height: 35px;\"\u003e\u003cspan\u003e✓\u003c\/span\u003e\u003c\/td\u003e\n\u003ctd style=\"width: 64.6406px; height: 35px;\"\u003e\u003cspan\u003e✓\u003c\/span\u003e\u003c\/td\u003e\n\u003c\/tr\u003e\n\u003ctr style=\"height: 35px;\"\u003e\n\u003ctd style=\"width: 732.359px; height: 35px;\"\u003e\u003cspan\u003eQuick-start Wizards provide step-by-step instructions and explanations for basic set-up for new users\u003c\/span\u003e\u003c\/td\u003e\n\u003ctd style=\"width: 52px; height: 35px;\"\u003e\u003cspan\u003e✓\u003c\/span\u003e\u003c\/td\u003e\n\u003ctd style=\"width: 64.6406px; height: 35px;\"\u003e\u003cspan\u003e✓\u003c\/span\u003e\u003c\/td\u003e\n\u003c\/tr\u003e\n\u003ctr style=\"height: 35px;\"\u003e\n\u003ctd style=\"width: 732.359px; height: 35px;\"\u003e\u003cspan\u003eQuick downloads and easy logger set-up - driver based. Ability to connect to SRX \u0026amp; JR2000. Setup most logger features - download, graph, export, print\u003c\/span\u003e\u003c\/td\u003e\n\u003ctd style=\"width: 52px; height: 35px;\"\u003e\u003cspan\u003e✓\u003c\/span\u003e\u003c\/td\u003e\n\u003ctd style=\"width: 64.6406px; height: 35px;\"\u003e\u003cspan\u003e✓\u003c\/span\u003e\u003c\/td\u003e\n\u003c\/tr\u003e\n\u003ctr style=\"height: 35px;\"\u003e\n\u003ctd style=\"width: 732.359px; height: 35px;\"\u003e\u003cspan\u003eOne-touch table views - copy \u0026amp; paste to other programs\u003c\/span\u003e\u003c\/td\u003e\n\u003ctd style=\"width: 52px; height: 35px;\"\u003e\u003cspan\u003e✓\u003c\/span\u003e\u003c\/td\u003e\n\u003ctd style=\"width: 64.6406px; height: 35px;\"\u003e\u003cspan\u003e✓\u003c\/span\u003e\u003c\/td\u003e\n\u003c\/tr\u003e\n\u003ctr style=\"height: 35px;\"\u003e\n\u003ctd style=\"width: 732.359px; height: 35px;\"\u003e\u003cspan\u003ePresentation quality graphs - fixed comments \u0026amp; data labels\u003c\/span\u003e\u003c\/td\u003e\n\u003ctd style=\"width: 52px; height: 35px;\"\u003e\u003cspan\u003e✓\u003c\/span\u003e\u003c\/td\u003e\n\u003ctd style=\"width: 64.6406px; height: 35px;\"\u003e\u003cspan\u003e✓\u003c\/span\u003e\u003c\/td\u003e\n\u003c\/tr\u003e\n\u003ctr style=\"height: 35px;\"\u003e\n\u003ctd style=\"width: 732.359px; height: 35px;\"\u003e\u003cspan\u003eExport capabilities (TXT, BMP, PDF, JPG, and CSV formats)\u003c\/span\u003e\u003c\/td\u003e\n\u003ctd style=\"width: 52px; height: 35px;\"\u003e\u003cspan\u003e✓\u003c\/span\u003e\u003c\/td\u003e\n\u003ctd style=\"width: 64.6406px; height: 35px;\"\u003e\u003cspan\u003e✓\u003c\/span\u003e\u003c\/td\u003e\n\u003c\/tr\u003e\n\u003ctr style=\"height: 35px;\"\u003e\n\u003ctd style=\"width: 732.359px; height: 35px;\"\u003e\u003cspan\u003eOpen multiple logger connections simultaneously.\u003c\/span\u003e\u003c\/td\u003e\n\u003ctd style=\"width: 52px; height: 35px;\"\u003e\u003cspan\u003e✓\u003c\/span\u003e\u003c\/td\u003e\n\u003ctd style=\"width: 64.6406px; height: 35px;\"\u003e\u003cspan\u003e✓\u003c\/span\u003e\u003c\/td\u003e\n\u003c\/tr\u003e\n\u003c\/tbody\u003e\n\u003c\/table\u003e\n\u003cul\u003e\u003c\/ul\u003e","published_at":"2023-09-13T15:32:29-07:00","created_at":"2023-05-26T13:17:30-07:00","vendor":"ACR Systems","type":"","tags":["TRX Software Pro"],"price":17900,"price_min":17900,"price_max":17900,"available":true,"price_varies":false,"compare_at_price":null,"compare_at_price_min":0,"compare_at_price_max":0,"compare_at_price_varies":false,"variants":[{"id":42947223978155,"title":"Default Title","option1":"Default Title","option2":null,"option3":null,"sku":"91-0101","requires_shipping":false,"taxable":true,"featured_image":null,"available":true,"name":"TrendReader TRX Pro","public_title":null,"options":["Default Title"],"price":17900,"weight":0,"compare_at_price":null,"inventory_management":null,"barcode":"","requires_selling_plan":false,"selling_plan_allocations":[],"quantity_rule":{"min":1,"max":null,"increment":1}}],"images":["\/\/www.acrdatasolutions.com\/cdn\/shop\/files\/Capture1_bbec0f36-db6a-4bc1-905d-aed69e0d190b.png?v=1694513361"],"featured_image":"\/\/www.acrdatasolutions.com\/cdn\/shop\/files\/Capture1_bbec0f36-db6a-4bc1-905d-aed69e0d190b.png?v=1694513361","options":["Title"],"media":[{"alt":null,"id":27063736336555,"position":1,"preview_image":{"aspect_ratio":1.162,"height":930,"width":1081,"src":"\/\/www.acrdatasolutions.com\/cdn\/shop\/files\/Capture1_bbec0f36-db6a-4bc1-905d-aed69e0d190b.png?v=1694513361"},"aspect_ratio":1.162,"height":930,"media_type":"image","src":"\/\/www.acrdatasolutions.com\/cdn\/shop\/files\/Capture1_bbec0f36-db6a-4bc1-905d-aed69e0d190b.png?v=1694513361","width":1081}],"requires_selling_plan":false,"selling_plan_groups":[],"content":"\u003cp\u003e \u003c\/p\u003e\n\u003cp data-mce-fragment=\"1\"\u003ePowerful graphing \u0026amp; analysis software designed exclusively for ACR's SRX and JR product families. Available in both Basic \u0026amp; Pro versions.\u003c\/p\u003e\n\u003cp data-mce-fragment=\"1\"\u003e\u003ca href=\"https:\/\/acrsoftware.s3.us-west-1.amazonaws.com\/Setup+for+ACR+TrendReader+X.EXE\"\u003e\u003cstrong\u003eTRX Basic\u003c\/strong\u003e\u003c\/a\u003e - available at no charge when you purchase any SRX model\u003c\/p\u003e\n\u003cp data-mce-fragment=\"1\"\u003e\u003cstrong\u003eTRX Pro\u003c\/strong\u003e - requires a license key to activate Pro Features\u003c\/p\u003e\n\u003ctable style=\"width: 871px; height: 675.909px;\"\u003e\n\u003ctbody\u003e\n\u003ctr style=\"height: 39.2045px;\"\u003e\n\u003cth style=\"width: 732.359px; height: 39.2045px; text-align: left;\"\u003eFeatures \u0026amp; Benefits\u003c\/th\u003e\n\u003cth style=\"width: 52px; height: 39.2045px;\"\u003eTRX Pro\u003c\/th\u003e\n\u003cth style=\"width: 64.6406px; height: 39.2045px;\"\u003eTRX Basic\u003c\/th\u003e\n\u003c\/tr\u003e\n\u003ctr style=\"height: 19.6023px;\"\u003e\n\u003ctd style=\"width: 732.359px; height: 19.6023px;\"\u003eAbility to send emails in response to alarm from logger\u003c\/td\u003e\n\u003ctd style=\"width: 52px; height: 19.6023px;\"\u003e✓\u003c\/td\u003e\n\u003ctd style=\"width: 64.6406px; height: 19.6023px;\"\u003e\u003cbr\u003e\u003c\/td\u003e\n\u003c\/tr\u003e\n\u003ctr style=\"height: 38.9915px;\"\u003e\n\u003ctd style=\"width: 732.359px; height: 38.9915px;\"\u003eAbility to generate a Summary Report with data from Analytics section and generate a graph\u003c\/td\u003e\n\u003ctd style=\"width: 52px; height: 38.9915px;\"\u003e✓\u003c\/td\u003e\n\u003ctd style=\"width: 64.6406px; height: 38.9915px;\"\u003e\u003cbr\u003e\u003c\/td\u003e\n\u003c\/tr\u003e\n\u003ctr style=\"height: 38.9915px;\"\u003e\n\u003ctd style=\"width: 732.359px; height: 38.9915px;\"\u003eAbility to Concatenate graphs\u003c\/td\u003e\n\u003ctd style=\"width: 52px; height: 38.9915px;\"\u003e✓\u003c\/td\u003e\n\u003ctd style=\"width: 64.6406px; height: 38.9915px;\"\u003e\u003cbr\u003e\u003c\/td\u003e\n\u003c\/tr\u003e\n\u003ctr style=\"height: 19.6023px;\"\u003e\n\u003ctd style=\"width: 732.359px; height: 19.6023px;\"\u003eCan create Compound line equations for additional data manipulation.\u003c\/td\u003e\n\u003ctd style=\"width: 52px; height: 19.6023px;\"\u003e✓\u003c\/td\u003e\n\u003ctd style=\"width: 64.6406px; height: 19.6023px;\"\u003e\u003cbr\u003e\u003c\/td\u003e\n\u003c\/tr\u003e\n\u003ctr style=\"height: 38.9915px;\"\u003e\n\u003ctd style=\"width: 732.359px; height: 38.9915px;\"\u003eCan create custom Linear, Thermistor, Polynomial and User defined equations.\u003c\/td\u003e\n\u003ctd style=\"width: 52px; height: 38.9915px;\"\u003e✓\u003c\/td\u003e\n\u003ctd style=\"width: 64.6406px; height: 38.9915px;\"\u003e\u003c\/td\u003e\n\u003c\/tr\u003e\n\u003ctr style=\"height: 38.9915px;\"\u003e\n\u003ctd style=\"width: 732.359px; height: 38.9915px;\"\u003eCompatible with SmartReader Plus data loggers\u003c\/td\u003e\n\u003ctd style=\"width: 52px; height: 38.9915px;\"\u003e✓\u003c\/td\u003e\n\u003ctd style=\"width: 64.6406px; height: 38.9915px;\"\u003e\u003c\/td\u003e\n\u003c\/tr\u003e\n\u003ctr style=\"height: 38.9915px;\"\u003e\n\u003ctd style=\"width: 732.359px; height: 38.9915px;\"\u003e\u003cspan\u003eAbility to add custom units not found resident in the software\u003c\/span\u003e\u003c\/td\u003e\n\u003ctd style=\"width: 52px; height: 38.9915px;\"\u003e\u003cspan\u003e✓\u003c\/span\u003e\u003c\/td\u003e\n\u003ctd style=\"width: 64.6406px; height: 38.9915px;\"\u003e\u003cspan\u003e\u003c\/span\u003e\u003c\/td\u003e\n\u003c\/tr\u003e\n\u003ctr style=\"height: 19.6023px;\"\u003e\n\u003ctd style=\"width: 732.359px; height: 19.6023px;\"\u003e\u003cspan\u003eAbility to merge graphs (open multiple graphs simultaneously)\u003c\/span\u003e\u003c\/td\u003e\n\u003ctd style=\"width: 52px; height: 19.6023px;\"\u003e\u003cspan\u003e✓\u003c\/span\u003e\u003c\/td\u003e\n\u003ctd style=\"width: 64.6406px; height: 19.6023px;\"\u003e\u003cspan\u003e✓\u003c\/span\u003e\u003c\/td\u003e\n\u003c\/tr\u003e\n\u003ctr style=\"height: 38.9915px;\"\u003e\n\u003ctd style=\"width: 732.359px; height: 38.9915px;\"\u003e\u003cspan\u003eAbility to configure both Warning \u0026amp; Critical alarms\u003c\/span\u003e\u003c\/td\u003e\n\u003ctd style=\"width: 52px; height: 38.9915px;\"\u003e\u003cspan\u003e✓\u003c\/span\u003e\u003c\/td\u003e\n\u003ctd style=\"width: 64.6406px; height: 38.9915px;\"\u003e\u003cspan\u003e✓\u003c\/span\u003e\u003c\/td\u003e\n\u003c\/tr\u003e\n\u003ctr style=\"height: 19.6023px;\"\u003e\n\u003ctd style=\"width: 732.359px; height: 19.6023px;\"\u003e\u003cspan\u003eCan create custom Linear equations.\u003c\/span\u003e\u003c\/td\u003e\n\u003ctd style=\"width: 52px; height: 19.6023px;\"\u003e\u003cspan\u003e✓\u003c\/span\u003e\u003c\/td\u003e\n\u003ctd style=\"width: 64.6406px; height: 19.6023px;\"\u003e\u003cspan\u003e✓\u003c\/span\u003e\u003c\/td\u003e\n\u003c\/tr\u003e\n\u003ctr style=\"height: 19.6023px;\"\u003e\n\u003ctd style=\"width: 732.359px; height: 19.6023px;\"\u003e\u003cspan\u003eReal Time Graphing approx. every 5 seconds (not adjustable). Pro has more data points (1000 vs 50)\u003c\/span\u003e\u003c\/td\u003e\n\u003ctd style=\"width: 52px; height: 19.6023px;\"\u003e\u003cspan\u003e✓\u003c\/span\u003e\u003c\/td\u003e\n\u003ctd style=\"width: 64.6406px; height: 19.6023px;\"\u003e\u003cspan\u003e✓\u003c\/span\u003e\u003c\/td\u003e\n\u003c\/tr\u003e\n\u003ctr style=\"height: 38.9915px;\"\u003e\n\u003ctd style=\"width: 732.359px; height: 38.9915px;\"\u003e\u003cspan\u003eDownloaded data can be displayed as a Graph or as a Table for easy export\u003c\/span\u003e\u003c\/td\u003e\n\u003ctd style=\"width: 52px; height: 38.9915px;\"\u003e\u003cspan\u003e✓\u003c\/span\u003e\u003c\/td\u003e\n\u003ctd style=\"width: 64.6406px; height: 38.9915px;\"\u003e\u003cspan\u003e✓\u003c\/span\u003e\u003c\/td\u003e\n\u003c\/tr\u003e\n\u003ctr style=\"height: 19.6023px;\"\u003e\n\u003ctd style=\"width: 732.359px; height: 19.6023px;\"\u003e\u003cspan\u003eDownloaded graph analysis (min, max. etc.)\u003c\/span\u003e\u003c\/td\u003e\n\u003ctd style=\"width: 52px; height: 19.6023px;\"\u003e\u003cspan\u003e✓\u003c\/span\u003e\u003c\/td\u003e\n\u003ctd style=\"width: 64.6406px; height: 19.6023px;\"\u003e\u003cspan\u003e✓\u003c\/span\u003e\u003c\/td\u003e\n\u003c\/tr\u003e\n\u003ctr style=\"height: 19.6023px;\"\u003e\n\u003ctd style=\"width: 732.359px; height: 19.6023px;\"\u003e\u003cspan\u003eGraph with all channels on a single graph, or Stacked by unit type, for a cleaner looking graph\u003c\/span\u003e\u003c\/td\u003e\n\u003ctd style=\"width: 52px; height: 19.6023px;\"\u003e\u003cspan\u003e✓\u003c\/span\u003e\u003c\/td\u003e\n\u003ctd style=\"width: 64.6406px; height: 19.6023px;\"\u003e\u003cspan\u003e✓\u003c\/span\u003e\u003c\/td\u003e\n\u003c\/tr\u003e\n\u003ctr style=\"height: 66.946px;\"\u003e\n\u003ctd style=\"width: 732.359px; height: 66.946px;\"\u003e\u003cspan\u003eAbility to add comments, label data points \u0026amp; zoom graph\u003c\/span\u003e\u003c\/td\u003e\n\u003ctd style=\"width: 52px; height: 66.946px;\"\u003e\u003cspan\u003e✓\u003c\/span\u003e\u003c\/td\u003e\n\u003ctd style=\"width: 64.6406px; height: 66.946px;\"\u003e\u003cspan\u003e✓\u003c\/span\u003e\u003c\/td\u003e\n\u003c\/tr\u003e\n\u003ctr style=\"height: 35px;\"\u003e\n\u003ctd style=\"width: 732.359px; height: 35px;\"\u003e\u003cspan\u003eAbility to turn graph channels on\/off, specify Y - min\/max\/auto\u003c\/span\u003e\u003c\/td\u003e\n\u003ctd style=\"width: 52px; height: 35px;\"\u003e\u003cspan\u003e✓\u003c\/span\u003e\u003c\/td\u003e\n\u003ctd style=\"width: 64.6406px; height: 35px;\"\u003e\u003cspan\u003e✓\u003c\/span\u003e\u003c\/td\u003e\n\u003c\/tr\u003e\n\u003ctr style=\"height: 19.6023px;\"\u003e\n\u003ctd style=\"width: 732.359px; height: 19.6023px;\"\u003e\u003cspan\u003eEasy to calibrate, the offset is in engineering values instead of bytes, making it more intuitive\u003c\/span\u003e\u003c\/td\u003e\n\u003ctd style=\"width: 52px; height: 19.6023px;\"\u003e\u003cspan\u003e✓\u003c\/span\u003e\u003c\/td\u003e\n\u003ctd style=\"width: 64.6406px; height: 19.6023px;\"\u003e\u003cspan\u003e✓\u003c\/span\u003e\u003c\/td\u003e\n\u003c\/tr\u003e\n\u003ctr style=\"height: 35px;\"\u003e\n\u003ctd style=\"width: 732.359px; height: 35px;\"\u003e\u003cspan\u003eDelay start can be set to 2 months away (SRX)\u003c\/span\u003e\u003c\/td\u003e\n\u003ctd style=\"width: 52px; height: 35px;\"\u003e\u003cspan\u003e✓\u003c\/span\u003e\u003c\/td\u003e\n\u003ctd style=\"width: 64.6406px; height: 35px;\"\u003e\u003cspan\u003e✓\u003c\/span\u003e\u003c\/td\u003e\n\u003c\/tr\u003e\n\u003ctr style=\"height: 35px;\"\u003e\n\u003ctd style=\"width: 732.359px; height: 35px;\"\u003e\u003cspan\u003eQuick-start Wizards provide step-by-step instructions and explanations for basic set-up for new users\u003c\/span\u003e\u003c\/td\u003e\n\u003ctd style=\"width: 52px; height: 35px;\"\u003e\u003cspan\u003e✓\u003c\/span\u003e\u003c\/td\u003e\n\u003ctd style=\"width: 64.6406px; height: 35px;\"\u003e\u003cspan\u003e✓\u003c\/span\u003e\u003c\/td\u003e\n\u003c\/tr\u003e\n\u003ctr style=\"height: 35px;\"\u003e\n\u003ctd style=\"width: 732.359px; height: 35px;\"\u003e\u003cspan\u003eQuick downloads and easy logger set-up - driver based. Ability to connect to SRX \u0026amp; JR2000. Setup most logger features - download, graph, export, print\u003c\/span\u003e\u003c\/td\u003e\n\u003ctd style=\"width: 52px; height: 35px;\"\u003e\u003cspan\u003e✓\u003c\/span\u003e\u003c\/td\u003e\n\u003ctd style=\"width: 64.6406px; height: 35px;\"\u003e\u003cspan\u003e✓\u003c\/span\u003e\u003c\/td\u003e\n\u003c\/tr\u003e\n\u003ctr style=\"height: 35px;\"\u003e\n\u003ctd style=\"width: 732.359px; height: 35px;\"\u003e\u003cspan\u003eOne-touch table views - copy \u0026amp; paste to other programs\u003c\/span\u003e\u003c\/td\u003e\n\u003ctd style=\"width: 52px; height: 35px;\"\u003e\u003cspan\u003e✓\u003c\/span\u003e\u003c\/td\u003e\n\u003ctd style=\"width: 64.6406px; height: 35px;\"\u003e\u003cspan\u003e✓\u003c\/span\u003e\u003c\/td\u003e\n\u003c\/tr\u003e\n\u003ctr style=\"height: 35px;\"\u003e\n\u003ctd style=\"width: 732.359px; height: 35px;\"\u003e\u003cspan\u003ePresentation quality graphs - fixed comments \u0026amp; data labels\u003c\/span\u003e\u003c\/td\u003e\n\u003ctd style=\"width: 52px; height: 35px;\"\u003e\u003cspan\u003e✓\u003c\/span\u003e\u003c\/td\u003e\n\u003ctd style=\"width: 64.6406px; height: 35px;\"\u003e\u003cspan\u003e✓\u003c\/span\u003e\u003c\/td\u003e\n\u003c\/tr\u003e\n\u003ctr style=\"height: 35px;\"\u003e\n\u003ctd style=\"width: 732.359px; height: 35px;\"\u003e\u003cspan\u003eExport capabilities (TXT, BMP, PDF, JPG, and CSV formats)\u003c\/span\u003e\u003c\/td\u003e\n\u003ctd style=\"width: 52px; height: 35px;\"\u003e\u003cspan\u003e✓\u003c\/span\u003e\u003c\/td\u003e\n\u003ctd style=\"width: 64.6406px; height: 35px;\"\u003e\u003cspan\u003e✓\u003c\/span\u003e\u003c\/td\u003e\n\u003c\/tr\u003e\n\u003ctr style=\"height: 35px;\"\u003e\n\u003ctd style=\"width: 732.359px; height: 35px;\"\u003e\u003cspan\u003eOpen multiple logger connections simultaneously.\u003c\/span\u003e\u003c\/td\u003e\n\u003ctd style=\"width: 52px; height: 35px;\"\u003e\u003cspan\u003e✓\u003c\/span\u003e\u003c\/td\u003e\n\u003ctd style=\"width: 64.6406px; height: 35px;\"\u003e\u003cspan\u003e✓\u003c\/span\u003e\u003c\/td\u003e\n\u003c\/tr\u003e\n\u003c\/tbody\u003e\n\u003c\/table\u003e\n\u003cul\u003e\u003c\/ul\u003e"}